Using DiskPulse Pie Charts | ||||||||
|
The DiskPulse disk change monitor provides multiple types of pie charts capable of showing the number of changed files and the amount of changed disk space per file extension, change type, file size, change directory, file attribute and file type. In order to open the charts dialog, press the 'Charts' button located on the main toolbar and select an appropriate chart type. 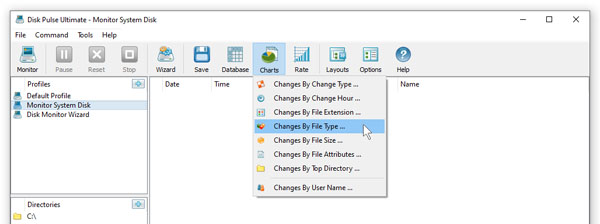
The file extensions pie chart shows the number of changed files per file extension. The chart mode selector, which is located in the bottom side of the dialog, provides the ability to switch between the available chart modes. For example, in order to display the amount of disk space per file extension, click the chart mode combo box and set an appropriate chart mode. 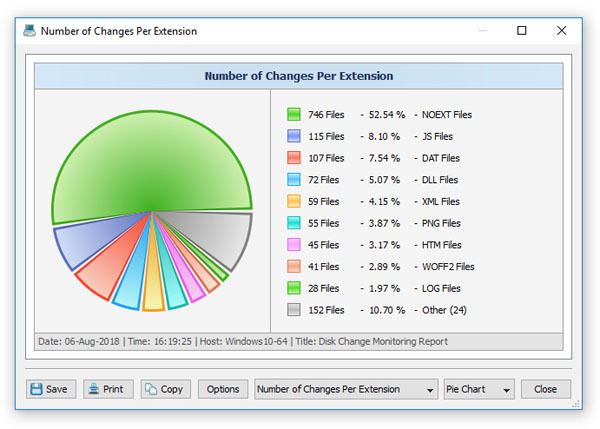
Depending on the currently selected categorization mode, the charts dialog shows numbers of files or the changed disk space per extension, change type, file size or file type. The mode selector, which is located in the bottom side of the dialog, provides the ability to switch between the available chart modes. 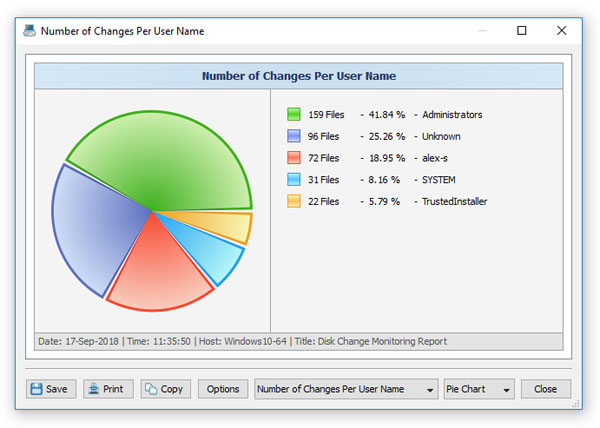
By default, the charts dialog shows statistics for the currently displayed change categories. For example, in order to open a chart showing numbers of files per file category, set the 'Categorize by File Type' change categorization mode and open the charts dialog. 
In addition, the charts dialog provides the user with the ability to copy the displayed chart image to the clipboard allowing one to easily integrate DiskPulse charts into user's documents and presentations. In order to customize the chart description, press the 'Options' button and specify a custom chart date, time or chart title.
|
|
|

|

